ENERGY SITE MANAGEMENT EQUATION & A PROPOSED PROCESS TO ESTABLISH ENERGY BALANCES ON SITE
Solar energy is the source of life and the principal factor of evolution and its interaction with site massing remains inevitable. As we transform the natural environment to our needs, we introduce hard surfaces such as roads, walls, widows and roof; they all absorb energy by radiation which transfer the heat at different rate and different time by conduction as well as release heat by convection. Also the structure requires energy for heating and cooling system to function thus a bigger quantity of energy or heat is produced and transferred back to the living site.
It is essential to reveal how the footprint and massing of a site manage the quantity of solar energy at pre-development state and compare them to the quantity of energy that the same site is going to produce after development. By subtracting the comparative results, we will discover the additional quantity of energy that site must manage therefore taking necessary measures to establish the natural balance of energy management on site.
The following study has been pursuit to explore energy site management equation prior and after development. The focus will be only on what quantity of solar energy that site and exterior envelop attract and as designer what measures we need to take to regulate the energy balance as it was at pre-development state. The energy required for basic function of the envelope and its production on site is subject to a separate study and it would not be included in the calculation because the necessary energy to be produced is equivalent to the energy that the envelope will consume independently.
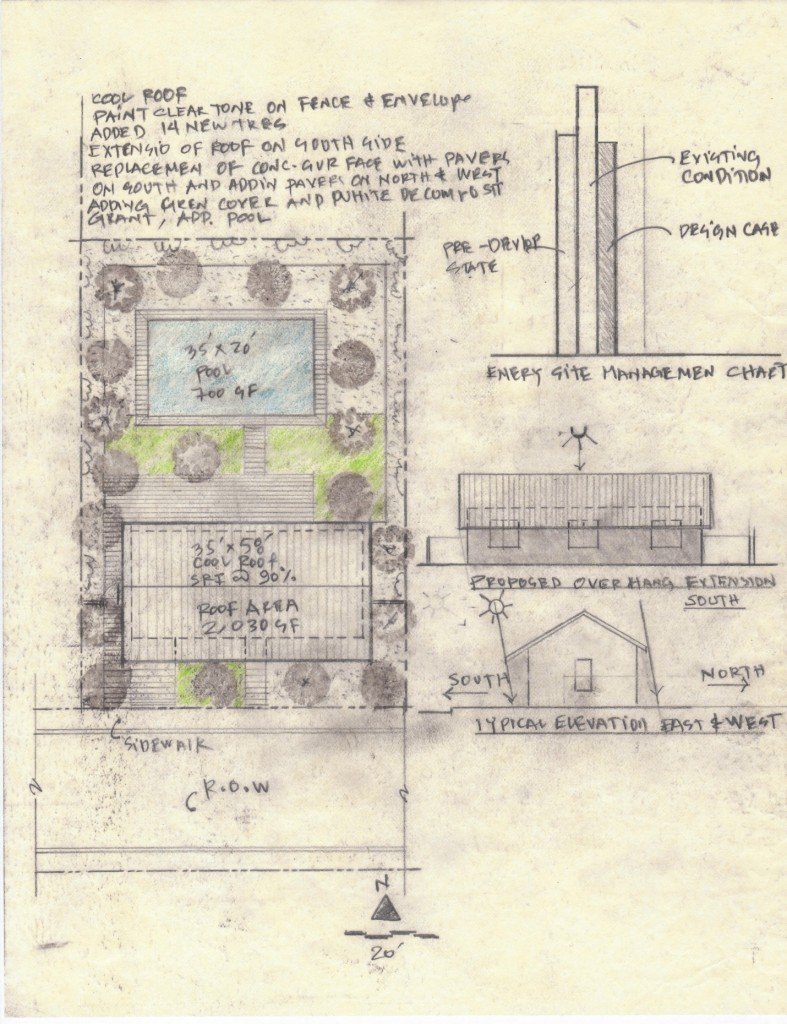
For study case I have chosen a typical existing single family residence in phoenix area:
Lot size 7,000 sf, building footprint 1,500 sf, east west oriented, climate zone 2,July 31st at 12PM, sun altitude 80o south. The warmest day in summer is chosen as the base for calculation,the radiation effect on various sides of a building is expressed in KBtu / ft2/ Day per below chart.
| Orientation – Phoenix Area | KBtu / ft 2 Day |
| East wall | 1.207 |
| South wall | 0.563 |
| West wall | 1.207 |
| North wall | 0.452 |
| East wall | 1.207 |
| Roof & horizontal surface | 2.596 |
*Reference: Design with Climate, Victor Olgyay
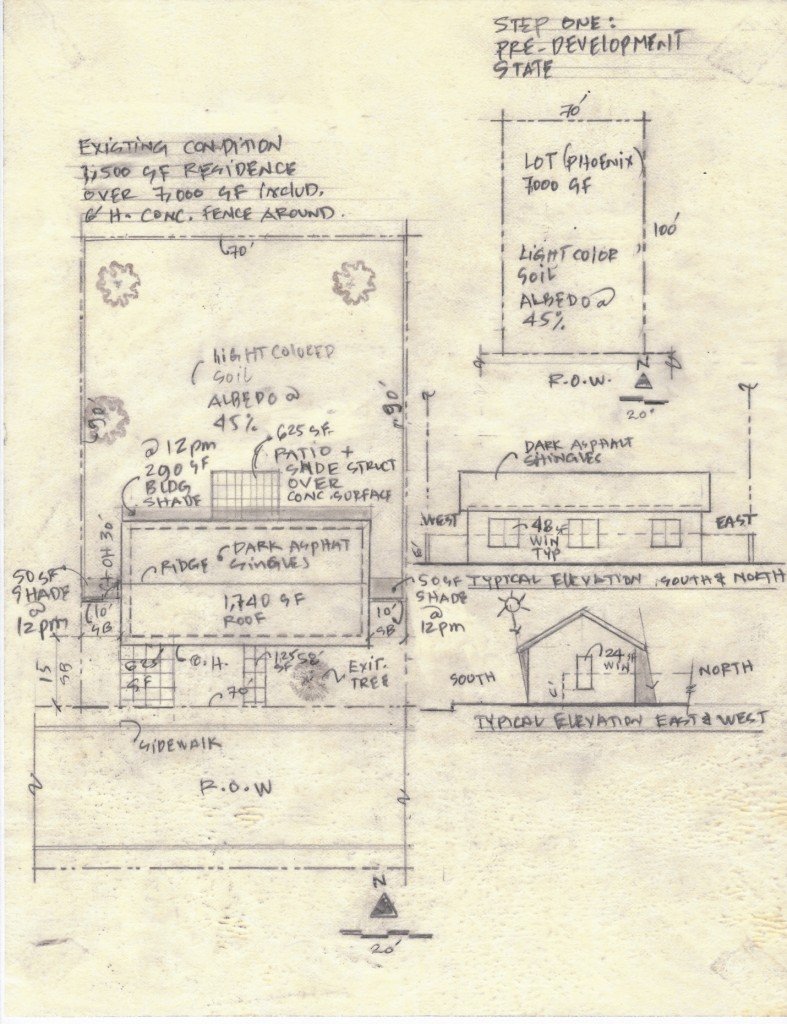
Step 1 – Inventory of energy on site at pre-development state:
a) Research historic data, referring to title and survey plan, we may find out waht site used to be at natural state.
b) Calculate the surface area considering the amount of solar energy that site is receiving,reflecting and absorbing at natural state.
Since the solar reflectance energy is reflected and not retained on site, we should focus on the portion that site absorbs and releases with lag time. We should also consider the amount of energy that is not reflected therefore is absorbed.
| Material | Surface area SF | SRI in. % | Absorpt. % | Calcs KBtu / Day |
| Site horz. surface Light colored soil |
70’x100’ = 7,000 – 226 = 6,774 Site – tree shade area |
45 | 55 | 2.596 x 6,774x 0.55 = 9,672 |
| 2 Exist. Deciduous trees 12’ Dia |
2 x 113 = 226 | 18 | 82 | 2.596 x 226 x 0.82 = 481 |
| Total energy attracted on site @ pre-development state |
Inventory 10,153 |
***Approximate albedo of light colored soil surface = 0.4 – 0.5
Within pre-existing Macroclimate, we have just discovered the amount of energy that site was generating and processing. As we modify a site, we create a Microclimate at the scale of site attracting more energy means producing more heat and enforcing Heat Island Affect.
The challenge will be to balance the total amount of energy on site with implementation of measures and strategies for proposed site and envelope therefore 10,153 KBtu / Day remains as a reference.
Step 2 – Survey of Existing Condition:
To survey and calculate the surface area of existing condition considering the amount of solar energy that is attract by site surface, site features and the existing envelope to reveal the total amount of attracted energy on site.
| Site | Surface area SF | SRI. % | Absorpt. % | Calcs KBtu / Day | |
| Conc. Fence E. | 6’ x 90’= 540 | 25 | 75 | 1.207 x 540 x 0.75 = 489 | |
| Conc. Fence S. | 6’ x 20’ = 320 | 25 | 75 | 0.563 x 320 x 0.75 = 135 | |
| Conc. Fence W. | 6’ x 90’= 540 | 25 | 75 | 1.207 x 540 x 0.75 = 489 | |
| Conc. Fence N. | 6’ x 20’= 120 | 25 | 75 | 0.452 x 120 x 0.75 = 41 | |
| Conc. pads | 625+125+600=1,350
Minus 290 shaded Area on North of bldg. |
20 | 80 | 2.596 x 1,060 x 0.80 = 2, 201 | |
| 4 Exist. Trees 25’ Dia. | 4 x 113 = 452 | 15 | 85 | 2.596 x 452 x 0.85 = 997
|
|
| Remaining Site Surface | 7,000–1,740-1,350-1,963-1,350-390 =
Site–roof area-tree’s area-conc. pads-shades areas |
45 | 55 | 2.596 x 1,557 x 0.55 = 2,223 | |
| Building | Surface area SF | SRI. % | Absorpt. % | Calcs | |
| Medium dark paint / stucco – East | 420 sf wall. 24 sf window | 20
– |
80
71SHGC trans. |
1.207x420x 0.80 = 552
1.207 x 24 x 0.71 = 20 |
|
| Medium dark paint / stucco South | 632 sf wall.
80% of south wall shaded by overhang includ. windows Count 50% of SHGC 144 sf window |
20
– |
80
71SHGC trans. |
0.563x420x 0.80 x 0.80 = 324
0.563 x 144x 0.80 x 0.50 =32 |
|
| Medium dark paint /. stucco West | 420 sf wall.
24 sf window |
20
– |
80
71SHGC trans. |
1.207x420x 0.80 = 552
1.207 x 24 x 0.71 = 20 |
|
| Medium dark paint / stucco – North | 632 sf wall.
144 sf window |
20
– |
80
71SHGC trans. |
0.452 x 632 x 0.80 = 229
0.452 x 144 x 0.71 = 46 |
|
| Roof w. gray asphalt singles | 58 x 30 including Overhang | 13 | 87 | 2.596 x 1,740 x .87 = 3,930 | |
| Total | 11, 626 KBtu / Day | ||||
| Total energy surplus on site @ existing condition |
11,626 -10,153=1,109 KBtu/Day |
||||
*Reference: Mechanical and Electrical Equipment for Buildings, Benjamin Stein, John S. Reynolds @ other sources
Step 3 – Comparing inventory with survey of existing conditions
: By subtraction the results reveals we have an excess of 11,626 -10,153 =1,473 KBtu /Day
At this point we should consider regulating site energy balance by surface improvement, landscape area and body of water, we should also revise the material of the exterior envelop for a better site energy balance.
Step 4 – Design Concept:
Selecting material with high albedo meaning less absorption; providing trees and shading, green cover, replacing aged concrete with new light color pavers and so on.
| Site | Surface area SF | SRI. % | Absorpt. % | Calcs KBtu / Day | |
| Conc. Fence E.
White acrylic paint |
6’ x 90’= 540 | 80 | 20 | 1.207 x 540 x 0.75 = 489 | |
| Conc. Fence S. | 6’ x 20’ = 320 | 80 | 20 | 0.563 x 320 x 0.75 = 135 | |
| Conc. Fence W. | 6’ x 90’= 540 | 80 | 20 | 1.207 x 540 x 0.75 = 489 | |
| Conc. Fence N. | 6’ x 20’= 120 | 80 | 20 | 0.452 x 120 x 0.75 = 41 | |
| Conc. Pads
Replaced w. clear conc. pavers |
625+125+600-285 –290 =775
Minus 290 shaded Area on North of bldg. Minus 285 tree shade |
70 | 30 | 2.596 x 775 x 0.80 = 604 | |
| 4 Exist. Trees. Added 15 new Trees, 4 +15=19 | 19 x 113 = 2,147 | 18 | 82 | 2.596 x 2,147 x0.82 = 4,570
|
|
| Green ground cover | 850 – 500 = 350
Ground cover – tree shade area |
20 | 80 | 2.596 x 350x 0.80 = 727 | |
| Pool clear background | 35 x 20 = 700 | 8 | 92 | 2.596 x 700x 0.92 = 1,672 | |
| Decomposed white granite cover | 2,120 – 1,465 = 651
DG’s Cover – tree shade area |
60 | 40 | 2.596 x 651x 0.40 = 676 | |
| Building | Surface area SF | SRI. % | Absorpt. % | Calcs | |
| clear paint / stucco – South | 632 sf wall.
100% of south wall shaded by overhang & 50% of the wall is shaded by trees – Count 50% only for radiant energy for South wall Windows Count 50% of SHGC 144 sf window |
80
– |
20
39 SHGC trans. |
0.563x632x0.20×0.50=36
0.563 x 144x 0.39 x 0.50 =16 |
|
| clear paint / stucco – West | 420 sf wall.
24 sf window Minus 50% shaded wall |
85
– |
15
27SHGC trans. |
1.207x420x 0.15x 0.50 = 38
1.207 x 24 x 0.27 = 8 |
|
| clear paint / stucco – North | 632 sf wall.
144 sf window 100% of North wall shaded by overhang & 30% of the wall is shaded by trees – Count 50% only for radiant energy for Notrh wall Windows Count 50% of SHGC |
80
– |
20
71SHGC trans. |
0.452x632x0.20×0.50 = 29
0.452x144x0.71×0.50 = 23 |
|
| Cool Roof | 58 x 35 = 2,030
Include. Extended Overhang 50% of roof is shaded by trees |
80 | 20 | 2.596x2030x0.20×0.50= 527 | |
| Total | 10,126 KBtu / Day | ||||
| Total energy surplus on site @ existing condition |
Study Case Result: 14,031 -9,995 = 4,036 KBtu /Day |
||||
Step 5 – Design comparasion at different stages:
- At pre-existingstate within natural environment site was generating:
10,153 KBtu / Day
- At existing condition with envelope & other features site was generating:
11,626 KBtu / Day
- At design case with material revision and site improvement site in generating:
10,126 KBtu / Day
Conclusion: At the design case calculations indicate that site s less than once it used to be part of natural environment despite we have built-in an envelope on. We can conclude the energy site management equation and the proposed process works.